Global Virtual Goods Market Size, Share, and COVID-19 Impact Analysis By Type (13-25, 25-35, 35-45, 45+), By Application (Male and Female), and By Region (North America, Europe, Asia-Pacific, Latin America, Middle East, and Africa), Analysis and Forecast 2023 - 2033
Industry: Consumer GoodsGlobal Virtual Goods Market Insights Forecasts to 2033
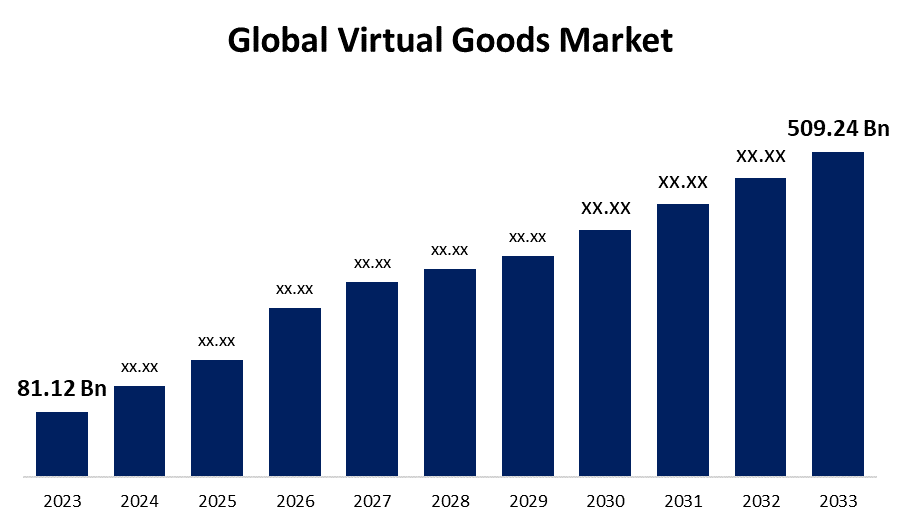
- The Global Virtual Goods Market Size was Valued at USD 81.12 Billion in 2023
- The Market Size is Growing at a CAGR of 20.17% from 2023 to 2033
- The Worldwide Virtual Goods Market Size is Expected to Reach USD 509.24 Billion by 2033
- Asia-Pacific is Expected to Grow the fastest during the forecast period.
Get more details on this report -
The Global Virtual Goods Market Size is Anticipated to Exceed USD 509.24 Billion by 2033, Growing at a CAGR of 20.17% from 2023 to 2033.
Market Overview
The portion of the digital economy referred to as the "Virtual Goods Market" is focused on the creation, exchange, and purchase of intangible goods or products that are specific to virtual environments, such as video games, social networking sites, virtual worlds, and online marketplaces. A range of virtual goods are available for purchase, including virtual currency, virtual collectibles, virtual real estate, virtual clothing and accessories, and virtual in-game goods. Game developers and other users provide virtual goods that have a financial significance in the real world. The phrase "microtransactions" is occasionally used to characterize the sale of virtual goods in games that utilize this business model. These games are commonly referred to as "freemium games." each game features a virtual income that can be used to purchase products featured in the game. The increasing availability of virtual reality (VR) technology is driving up demand for virtual goods on a worldwide scale. The market for interactive, immersive experiences that can be offered in alternate reality and gaming environments is growing.
Report Coverage
This research report categorizes the market for the global virtual goods market based on various segments and regions forecasts revenue growth and analyzes trends in each submarket. The report analyses the key growth drivers, opportunities, and challenges influencing the global virtual goods market. Recent market developments and competitive strategies such as expansion, product launch, development, partnership, merger, and acquisition have been included to draw the competitive landscape in the market. The report strategically identifies and profiles the key market players and analyses their core competencies in each sub-segment of the global virtual goods market.
Global Virtual Goods Market Report Coverage
| Report Coverage | Details |
|---|---|
| Base Year: | 2023 |
| Market Size in 2023 : | USD 81.12 Billion |
| Forecast Period: | 2023 – 2033 |
| Forecast Period CAGR 2023 – 2033 : | 20.17% |
| 023 – 2033 Value Projection: | USD 509.24 Billion |
| Historical Data for: | 2019-2022 |
| No. of Pages: | 220 |
| Tables, Charts & Figures: | 110 |
| Segments covered: | By Type, By Application, By Region |
| Companies covered:: | Meta Platforms, Inc., Tencent Holdings Ltd., Gree Inc., Mixi Inc., Hi5 Networks Inc., Bebo Inc., Myspace LLC, Tagged Inc., Zynga Inc., Kabam Inc., Others |
| Pitfalls & Challenges: | Covid-19 Impact, Challenge, Future,Growth and Analysis |
Get more details on this report -
Driving Factors
The development is made possible by the increasing accessibility of digital content due to the widespread availability of reasonably priced smartphones and enhanced internet infrastructure. This factor supports the growth of the virtual goods market due to increased usage representing more demand for virtual goods, which drives the market growth. In addition, the market for in-game purchases has grown significantly due in large part to the development of online gaming. Massive online communities have developed around video games, where users can express themselves through virtual goods and socialize in addition to playing games. These include character cosmetics, unique skills, or premium content that improves the game experience and drives growth in the market.
Restraining Factors
The lack of standardization and accessibility across different gaming platforms and platforms in the virtual goods market. The value of virtual goods can be restricted, and the failure of consumers to use or transfer them between contexts restricts the growth of the virtual goods market.
Market Segmentation
The global virtual goods market share is classified into type and application.
- The 35-45 segment is expected to hold a significant share of the global virtual goods market during the forecast period.
Based on the type, the global virtual goods market is divided into 13-25, 25-35, 35-45, 45+. Among these, the 35-45 segment is expected to hold a significant share of the global virtual goods market during the forecast period. 35–45 ages designed for consumers between the ages of 35 and 45 are referred to as virtual goods. Features that target this age group, including improved gaming experiences or more interesting material, are often included in these products. They are a crucial component of marketing initiatives because they can be utilized to advertise a company or product, particularly to this group of people.
- The male segment is expected to hold the largest share of the global virtual goods market during the forecast period.
Based on the application, the global virtual goods market is divided into male and female. Among these, the male segment is expected to hold the largest share of the global virtual goods market during the forecast period. The male population increase in online gaming and related business models has been significant. In addition, as social gaming becomes more and more popular, more males are playing and spending money on these platforms because they can play with people they know.
Regional Segment Analysis of the Global Virtual Goods Market
- North America (U.S., Canada, Mexico)
- Europe (Germany, France, U.K., Italy, Spain, Rest of Europe)
- Asia-Pacific (China, Japan, India, Rest of APAC)
- South America (Brazil and the Rest of South America)
- The Middle East and Africa (UAE, South Africa, Rest of MEA)
North America is anticipated to hold the largest share of the global virtual goods market over the predicted timeframe.

Get more details on this report -
North America is anticipated to hold the largest share of the global virtual goods market over the predicted timeframe. The significant number of people who use social networks and the widespread use of smartphones and wireless technologies are factors driving the growth of the virtual goods market in North America. Several additional factors that are driving the market are the large gaming population, the strong digital infrastructure, and the high rate of internet adoption. Utilizing in the region are some major virtual goods and gaming companies. In addition, several US companies are planning on launching their online games as a means of user interaction and brand promotion.
Asia-Pacific is expected to grow at the fastest pace in the global virtual goods market during the forecast period. Asia Pacific as a result of China's and other Southeast Asian countries' high demand for virtual goods. Asia Pacific's significant social network user bases, widespread smartphone use, and wireless technology have helped it maintain its place in the global virtual goods market. The popularity of social and casual games on mobile devices and social networking sites, along with the explosive development in sales of smartphones and tablets, has led to a rapidly expanding virtual goods market.
Competitive Analysis:
The report offers the appropriate analysis of the key organizations/companies involved within the global virtual goods market along with a comparative evaluation primarily based on their product offering, business overviews, geographic presence, enterprise strategies, segment market share, and SWOT analysis. The report also provides an elaborative analysis focusing on the current news and developments of the companies, which includes product development, innovations, joint ventures, partnerships, mergers & acquisitions, strategic alliances, and others. This allows for the evaluation of the overall competition within the market.
List of Key Companies
- Meta Platforms, Inc.
- Tencent Holdings Ltd.
- Gree Inc.
- Mixi Inc.
- Hi5 Networks Inc.
- Bebo Inc.
- Myspace LLC
- Tagged Inc.
- Zynga Inc.
- Kabam Inc.
- Others
Key Target Audience
- Market Players
- Investors
- End-users
- Government Authorities
- Consulting And Research Firm
- Venture capitalists
- Value-Added Resellers (VARs)
Recent Developments
- In September 2023, one of the first generative AI products that Meta Platforms announced to the public is a chatbot that can generate text responses and realistic-looking images. CEO Mark Zuckerberg disclosed the goods during a reception where he provided updates on the company's plans to build an immersive metaverse.
Market Segment
This study forecasts revenue at global, regional, and country levels from 2020 to 2033. Spherical Insights has segmented the global virtual goods market based on the below-mentioned segments:
Global Virtual Goods Market, By Type
- 13-25
- 25-35
- 35-45
- 45+
Global Virtual Goods Market, By Application
- Male
- Female
Global Virtual Goods Market, By Regional
- North America
- US
- Canada
- Mexico
- Europe
- Germany
- Uk
- France
- Italy
- Spain
- Russia
- Rest of Europe
- Asia Pacific
- China
- Japan
- India
- South Korea
- Australia
- Rest of Asia Pacific
- South America
- Brazil
- Argentina
- Rest of South America
- Middle East & Africa
- UAE
- Saudi Arabia
- Qatar
- South Africa
- Rest of the Middle East & Africa
Frequently Asked Questions (FAQ)
-
1. Which are the key companies that are currently operating within the market?Meta Platforms, Inc., Tencent Holdings Ltd., Gree Inc., Mixi Inc., Hi5 Networks Inc., Bebo Inc., Myspace LLC, Tagged Inc., Zynga Inc., Kabam Inc., and Others.
-
2. What is the size of the global virtual goods market?The global virtual goods market is expected to grow from USD 81.12 Billion in 2023 to USD 509.24 Billion by 2033, at a CAGR of 20.17% during the forecast period 2023-2033.
-
3. Which region is holding the largest share of the market?North America is anticipated to hold the largest share of the global virtual goods market over the predicted timeframe.
Need help to buy this report?